
Is gamma-hedging overhyped?
Is gamma-hedging overhyped?
What is gamma, why is it important, and what are some of the limitations of using it to predict price action

Gamma-hedging and its implications for explaining price evolution appear to be the topic du jour among the trading crowd of late. In general, I think it’s widely misunderstood and broadly misused. So in the following post, I hope to sketch out a high-level overview of what gamma is, why it can result in particular hedging patterns, and then enumerate some of the limitations of using it to predict subsequent price action. This discussion will not be mathematically rigorous, but it will hopefully allow one to begin to grasp the conceptual nature of things.
What is gamma?
I’m going to assume that if you’re reading this post, you have at least a rudimentary level of knowledge about what financial options are—like simple call and put options—so I’m not going to rehash an entire lesson here. But if we hope to understand gamma, we need to start with some basic concepts about options as instruments in general, including the fact that, like all financial products, when you establish a position you become exposed to risk. The most familiar risk to most traders/investors is directional risk; but options have exposure to other risk factors as well, like volatility, time, interest rates, etc.
The two primary risks that we will concern ourselves with today are direction and volatility.
When valuing options, we can attempt to quantify these risk factors by utilizing theoretical option pricing models (like the Black-Scholes model)1, but suffice it to say that the two primary risks we will concern ourselves with today are direction and volatility. Directional bias for an options position is measured by the Greek letter delta (Δ)—to make it easier to remember, think d=direction. So if one has a positive delta, they are bullish direction (or long-biased) in the underlying. If one has a negative delta, they are bearish direction (or short-biased) in the underlying. In the former case, the option position benefits from a rising underlying, and the latter from a falling one. Conceptually this is no different from the buying or selling of most financial instruments for directional speculation.
This now brings us to gamma, which is intimately related to delta. So, roughly speaking, what is gamma? Gamma (Greek letter Γ) tells you how your delta—directional bias—changes when the underlying price changes (the rate of change of your delta). So long gamma (positive gamma) means that your directional bias (delta) changes in the SAME direction as the underlying direction: so if the underlying is going up (+), you gain deltas (+) and want the underlying to continue going higher; if the underlying goes down (-), you lose deltas (-) and want the market to continue going down.2
Gamma tells you how your delta changes when the underlying price changes.
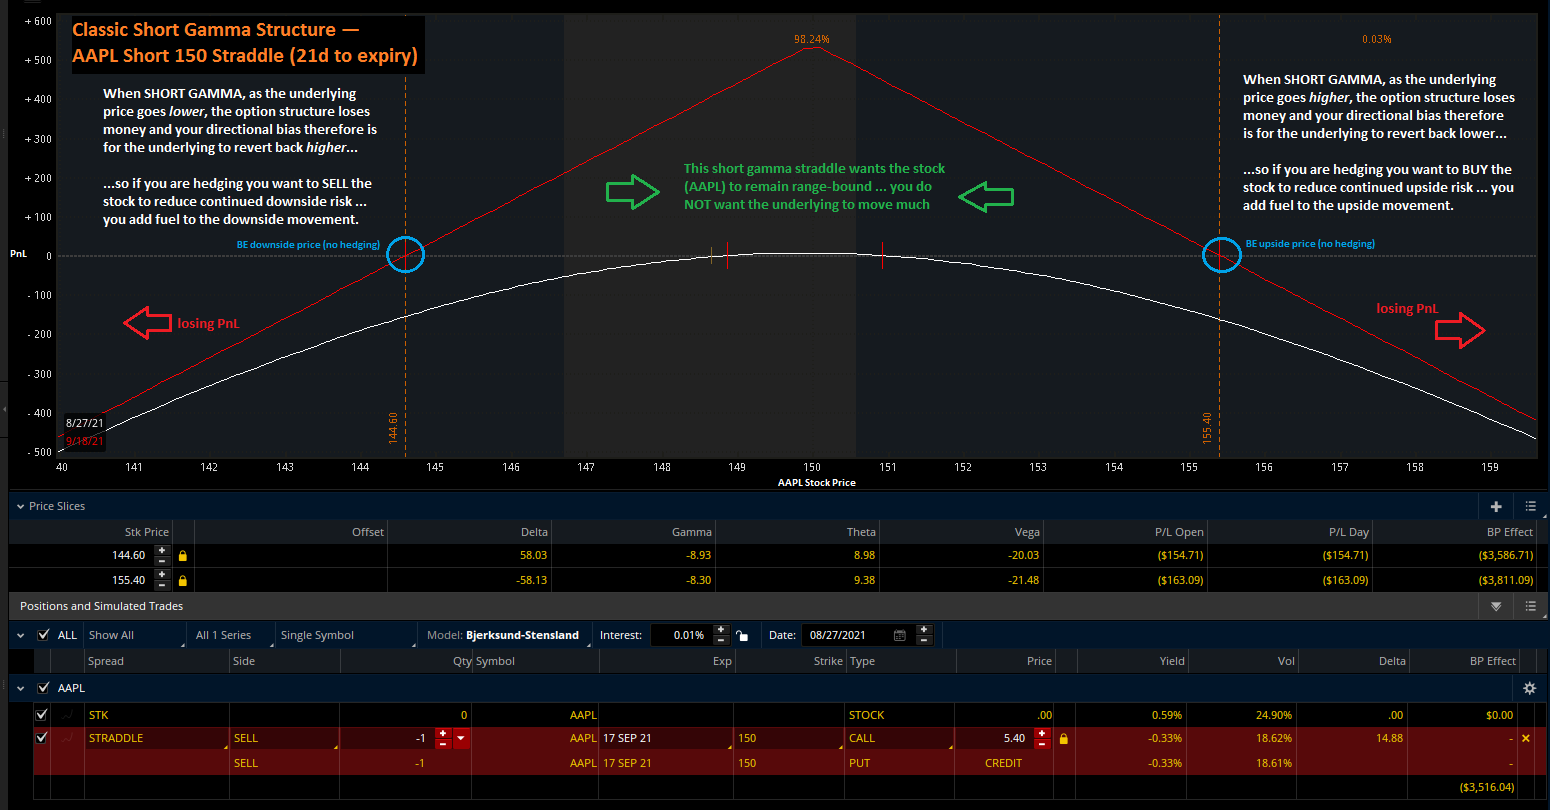
Short gamma (negative sign), by contrast, is best viewed through the lens of implying inverse directional bias to movement in the underlying. So if the underlying goes up (+), the delta on your option position moves the opposite way, namely down (-), you lose deltas. And if the underlying goes down (-), you gain deltas (+); so a short gamma option position does NOT want the underlying market to move much, and when it does move, your directional bias is such that it wants the underlying to revert the other way from which it came. Being short gamma is effectively a short volatility position.
A classic short gamma option structure is the straddle…
So this is where hedging comes in…
When you hedge, by definition, you are always taking the opposite side of your prevailing bias. So if you are long an asset, you go short something to hedge your downside risk; and if you are short, you hedge it by taking a position that benefits from going higher.
When you hedge you are always taking the opposite side of your prevailing bias.
Typically, the assumption is that options dealers (usually banks and market-makers) want to be neutral on direction (delta neutral as we say; give or take around zero deltas), thereby focusing risk exposure not on the directional movement of the underlying but on volatility, where it’s assumed those entities possess an edge. When most naive market participants talk about gamma-hedging, they quite often mean delta-hedging or hedging their directional risk when it has become excessive or overly sensitive to change. As a side note, volatility is known to have greater levels of predictability vis-à-vis direction, something I’ll explore in a later post.
When most naive market participants talk about gamma-hedging, they quite often actually mean delta-hedging.
So, as mentioned above, if you are long gamma, your directional bias gets increasingly long as the market goes higher (adding deltas), and to get rid of that long bias, you need to start selling (shorting) something. Conversely, when the market goes down, you need to start buying something to get rid of that additional short delta if you want to hedge your increasingly bearish bias.
Hence, long gamma, for those who want to be delta neutral, results in hedges that go AGAINST the primary market direction. So if the market is moving higher, you’re selling into it as it goes higher, or vice versa. A “buy low, sell high” kind of strategy. The consequence of doing such a thing is that long gamma-hedging can dampen volatility in the underlying: the hedge(s) create resistance (supply) as a market moves in a given direction.
Long gamma-hedging can dampen volatility in the underlying.
But if you are short gamma, then the opposite occurs when you are hedging. As the underlying goes higher, your position delta goes lower (remember inversely related), and to offset the lost deltas, you need to start buying some back or adding longs. And when the underlying goes lower, your position delta goes higher, and to offset those gained deltas, you need to start selling some. In other words, your hedges go WITH the primary market direction when you are short gamma: you begin buying in a rising market or selling in a falling market. This type of hedging is a “momentum” strategy, which is critical to note because engaging in such actions can fuel the prevailing move. You are effectively joining the buying frenzy or the rush to sell into the exit. Thus, short gamma hedges have the potential to exacerbate volatility and price moves. This is why one often hears about certain price moves being driven by “gamma-hedging” on social media or various news outlets.
Short gamma hedges have the potential to exacerbate volatility and price moves.
So gamma-hedging is important, right?
Yes, but not all the time. Institutional hedging of derivatives books can have a material impact on flows and the supply-demand equation. Domino effects from reflexivity (i.e., buying/selling begets more buying/selling, which drives prices higher/lower still) have always been a reality in markets, and gamma-hedging is but one form of this phenomenon.
Gamma-hedging is important, but NOT all the time.
But that doesn’t mean that every day or week that gamma-hedging (or any kind of hedging for that matter) is going to drive market prices in a substantial or meaningful fashion. We need to be more discerning about what is actually going into the estimate of aggregate gamma effects and when the phenomenon might take on more or less significance.
A few words of caution about using estimates of the effects of gamma-hedging to anticipate subsequent price evolution.
First and foremost, it’s a complicated calculation that is rife with assumptions. Like with any poorly constructed model: garbage in, garbage out. As such, one needs to be very careful about the inputs and model one is using.
Gamma-hedging implications are model estimates, not precise science.
At the core, though, what matters is net gamma across the aggregate market or relevant instrument, and this can be difficult to decipher because we don’t often know who is holding what or what their intent is. Investment banks tend to have the most insight into this arena, but that’s a far cry from accuracy or complete information. Furthermore, different participants manage their delta risk differently (and hence gamma), so assumptions about the consequences of aggregate delta-hedging can be flawed. After all, gamma isn’t the only risk that matters either.
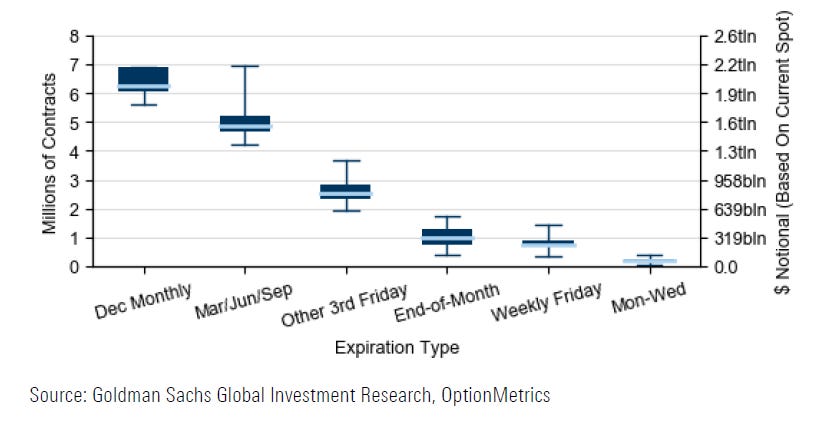
Second, but critically important, is that not all option expiration periods are of equal or even material significance. Quarter-end expirations tend to be significant market events—quadruple witching expiration, index rebalancing, and quarter-end window dressing are genuine material phenomena. Monthly expirations are somewhat less so, and other expiration periodicities—think weeklies/daily—might not matter at all.
Not all option expiration periods are of equal significance…
Additionally, if open interest is not heavily concentrated, then the estimates of gamma can be less meaningful. In general, you need size to move a market materially, and just because one or a few players are offsides on some trade(s) does NOT mean it will necessarily notably impact price.
Financial markets are dynamic nonlinear complex systems and defaulting to simple causal-effect modes of thinking rarely do them adequate justice.
Finally, the implications of hedging delta become more sensitive to near-the-money strikes as expiration approaches and less impactful everywhere else [in general, gamma, theta (time), and vega (IV) are greatest when an option is approximately at-the-money; and higher-order Greeks like charm, also known as “delta bleed”, which measures the change in delta with respect to time; and vanna, the change in delta with respect to IV, are also moving and impacting the pace of hedging flows]. This makes sense conceptually speaking because, for example, if you have 100 strike option approaching expiration and the stock is near that 100 price, then depending on where it closes one set of counterparties is going to be completely in-the-money and the others left with completely worthless positions, so the gamma (sensitivity of delta) is very high. But what if the dealers in the aggregate are short gamma at 100, long gamma at the next set of strikes not far above [think, for example, of the many dealers who are long calls for which the vast majority of participants want to be short for yield], and long gamma at some strikes not far below the market, how is the underlying going to react? You can see that it’s a bit murkier of a calculation without a greater level of insight into intent or hedging strategies.
The sensitivity of gamma to a change in the underlying price is known as “Speed”

So to wrap things up, the effects of gamma-hedging (and all hedging flows for that matter) on price evolution can be important, particularly around expiration periods of high significance and/or moments of unanticipated high volatility (volatility regime changes). But estimates of aggregate dealer gamma are just that, model estimates founded upon an array of assumptions, some of which can be questionable and should be treated as such. Expecting precision around levels related to potential hedging can be unreasonable at times, and divining the participant’s intent will always remain a practice cloaked in uncertainty when it comes to financial markets.
Mathematically speaking, gamma is a measure of curvature, the first derivative of delta or the second derivative with respect to the underlying price, for those of you that remember calculus.
I believe the introduction of the 1DTE options has changed the game. The SPX options have shifted to these short term series.